Context Matters


When it comes to numbers and data, context matters. The context in which we place particular numbers helps us make meaning of those numbers, and this is particularly important when we are talking about financial data.
Over many generations, managers and accountants have developed financial reporting tools that help them do their jobs. Balance sheets, income/expense (aka profit/loss) statements, and cash-flow statements are all excellent tools that can help managers manage. These financial statements put many numbers into a coherent whole so that a manager can see how various decisions about one line item (“How much can we spend on occupancy?”) affect the range of options for other line items (“After paying our expenses, how much money is left over to pay interest on a new loan?”).
But these same financial statements do not necessarily help the elected board of directors understand the overall financial health of their business. This article introduces some critical analytical tools that help boards understand the state of their business—an understanding that then becomes the basis for making sound governance decisions.
Providing context
If the co-op’s income statement showed that first quarter sales were $X, is that good, bad, or neither? It is hard to say, if we don’t have a context for our judgment. One context that commonly shows up on income statements is a comparison to the previous year—so the income statement might also tell you that sales in the same quarter last year were $Y.
What does that tell us about this year’s sales? If this year’s number is bigger, is that good, bad, or neither? Well, it depends on how much sales grew, how much we expected them to grow, how much of that growth can be attributed to inflation, and on how much it can be attributed to other internal or external factors.
Boards need more context than a simple comparison to the previous year in order to judge whether the number they’re looking at is good or not. For board-level decision-making, context is provided by several factors.
Relevance. Each director may be interested in different numbers, but interests alone are not the best criteria to use to provide context for the board’s work. Particular information is useful for making particular decisions; either too much or too little information tends to obfuscate rather than illuminate the truth. Boards should have a shared understanding of which information helps them do their governance work, and they should expect the manager’s monitoring reports to focus on that information.
Expectations. The board should have stated expectations about certain financial indicators, and it should look at data in relationship to those expectations. In the Cooperative Board Leadership Development (CBLD) Library, cdsconsulting.coop/cbldlibrary, you can find a Financial Conditions policy template that demonstrates an effective way for boards to set expectations.
Trends. Boards who want to see the “big picture” need tools that help them gain that perspective. Looking at charts that show trends over time for certain indicators can tell us a lot about where our business has been—and might help us understand where the business will go if we make certain decisions.
Plans. How did the actual performance compare to the plan? It is not essential for the actual and the planned performance to be identical, but comparing the two helps the board understand both the current operational reality and the manager’s planning skills.
Peer comparisons. Along with comparing one indicator to itself over time, boards should compare certain aspects of their business’s performance to that of similar businesses. This comparison can help us understand what is possible, what might be subpar, or at least what needs explanation or improvement.
How can we do this?
How do boards get the right amount of the right information that helps them carry out their leadership work? Along with the Financial Conditions policy template, in the CBLD Library you can find a Monitoring Report template that reflects the approach outlined in this article. The CBLD team has based our work on what we have learned by observing and supporting many co-op boards and managers over many years.
The depth of a board’s knowledge about their cooperative business, and the quality of the conversation among the board and manager, appear to be directly related to how much this leadership team makes use of clear trend and comparison information about the right financial indicators. The report template in the CBLD Library suggests how a presentation of charts reporting trends for 11 different indicators can provide critically important information to a board.
Below are a few examples of these charts, along with a few insights about the value this information provides.
Sales growth
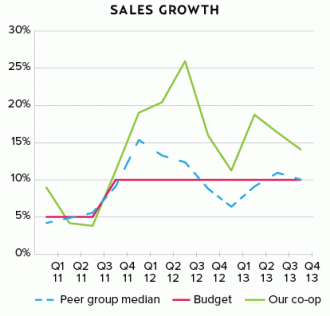
This chart (illustrated below) provides insights by clearly presenting actual performance information (the green line) within a proper context. Instead of only looking at the total sales number on this quarter’s income/expense statement, what if a board looked at this chart? What might they learn?
Maybe the board would remember (and new directors might learn for the first time) that their co-op experienced very strong sales growth for about a year, between mid-2011 and mid-2012. Maybe they would see the connection between the actual historical performance and the business plans and budgets: the co-op had planned for and achieved a big jump in sales in 2011, perhaps as a result of an expansion project.
Adding in the peer comparison here might also encourage the board to ask more about the external economic factors that might be driving the common pattern of ups and downs. None of this larger context is apparent if the board sees only an income/expense statement.
EBITDAP
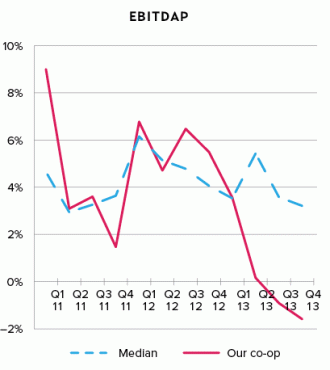
EBITDAP (Earnings Before Interest, Taxes, Depreciation/Amortization, and Patronage Refund) is a ratio that reflects core earnings of the business; it is sort of like an EKG, a way to analyze the body’s beating heart. By filtering out the effects of financing and accounting decisions, EBITDAP offers a useful way to compare your co-op’s profitability with that of its peers.
In this case, the board of “Our Co-op” might have a stated expectation that EBITDAP should be above the median for the co-op’s peer group. This chart tells the board that their business is seriously underperforming both in relation to what’s possible and to their expectations. In addition, the board knows that the downward trend in EBITDAP began in 2012, with serious decline in performance beginning in the 1st Quarter of 2013.
Probably the board has been asking their manager some important questions: What’s happening? Which aspects of this trend are common to all of our peers, and which are specific to our co-op? If you tell us there is a common cause, what is it, and how do you know? How are you managing this situation? What’s your plan?
The answers to these sorts of questions will then tell the board how particular business decisions have affected their co-op’s health, and about whether they have the right manager. If the board members had only looked at the income/expense statement and had never stated an expectation about this indicator of financial health, they might have never asked the important questions or heard the answers.
Debt to Equity
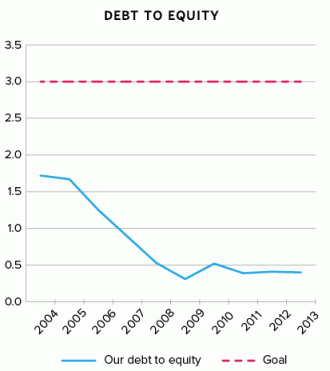
The debt-to-equity ratio is an indicator of how much money a co-op owes (things such as accounts payable and bank loans) in comparison to how much it owns (paid-in equity, retained patronage dividend, and retained earnings). Co-op leaders can use this ratio to understand and make decisions about the co-op’s ability to take on and pay back debt.
In the case of the example at the top of page 25, the board can see that their co-op has relatively very little debt, and this has been true for a decade or more. If the board had only been looking at an annual balance sheet each year, they likely would not see this trend. And this 10-year trend presentation allows both new and veteran directors to have the same level of awareness of where the co-op has been.
Perhaps this co-op’s board and manager have been talking about the very low debt load. Does it indicate that the co-op has been preparing for its next big expansion project after paying down the debt on the previous one? Or does it indicate that the co-op has been drifting, with no plan for the future? Or does it indicate that the board and/or manager have been very conservative, perhaps risk-averse?
By asking each other these questions about the past, and also by asking for impartial outsiders’ opinions and analyses, the leaders of this cooperative can perhaps begin to build alignment about its future direction.
Annual and quarterly reporting
It is a fairly standard practice to monitor a financial conditions policy on a quarterly basis. This sort of quick cycle of monitoring offers a way to see the seasonal variations that occur every year, as well as a way for a board to be aware of changes in financial conditions and operational issues before those changes become long-term trends. Charts showing a three-year picture of quarterly data make sense as part of a quarterly report.
Boards and managers should also step a little further back in order to gain a wider perspective; looking at these financial and operational trends over 10 years on an annual basis helps us make and understand the implications of long-term decisions. Charts summarizing 10 years of annual data make sense as part of an annual report.
You may have noticed that two of the sample charts in this article show three years of quarterly data, while the third chart shows 10 years of annual data. Both reporting cycles matter. The report template that you will find in the CBLD Library offers guidance for both quarterly and annual reports.
Making governance-level decisions
So, if you hear that one co-op did $1,000,000 ($1M) in sales last quarter, and another did $10M, which would you say performed better? Maybe we know now that the answer to that question requires different information, a different context. We know that we would ask of each: What did you expect? What does your sales growth trend look like? Did you perform as well as your peers?
We know that, in order for us to decide whether sales of $1M is good or bad, we need context. And we know that a handful of clearly presented charts can provide the information and context we need in order to assess our co-op’s financial and operational health.
Once we have made that assessment, then we can do what our co-op’s leaders need to be able to do: make decisions about what to do next. For a board, those decisions might be about whether to support or fire a manager, about whether we can agree to undertake a major expansion in order to better serve our community, or how to communicate with our member-owners key information about where we have been and where we are going.
Each of us wants our cooperatively owned business to make a positive difference in our community, and that is what this analytical work is all about. Let’s get good at understanding the trends and implications of past performance, so that we can get better at planning for and creating the future that we want.


